Introducing Kate GDB Plugin
Have you, like me, had to switch to an external debugger or run raw gdb in the terminal plugin to debug the C/C++ application you develop with Kate? That might not be necessary any more. There is now a “GDB Plugin” in trunk that gives you the power of raw GDB with some QAction candy for the most common actions.
I have always been a bit frustrated with not having a debugger directly in Kate, but too lazy/busy to start a debugger plugin project. Fortunately Ian Wakeling started this GDB plugin and got it off the ground. When I got introduced to it at Akademy, it triggered an itch in me to get this plugin into kdesdk and to add some features for the more point and click type of persons. As it seemed I had a bit more free time to spend on the plugin, Ian let me take over as maintainer.
Main features of the plugin:
– Jump to the corresponding file and line whenever gdb stops.
– Insert and remove breakpoints.
– Tool-bar buttons for the most often used actions like step into/over/out. Those actions can of course also be assigned to keyboard shortcuts.
– Execution markers and breakpoint markers on the icon border.
– A call stack tab for point and click navigation of the call stack.
– Optional IO redirection to a separate tab.
– Printing the value of the currently selected variable or expression. QStrings and friends are not supported (yet?).
– And last but not least. A GDB console for the full power of GDB.
And now the screen-shots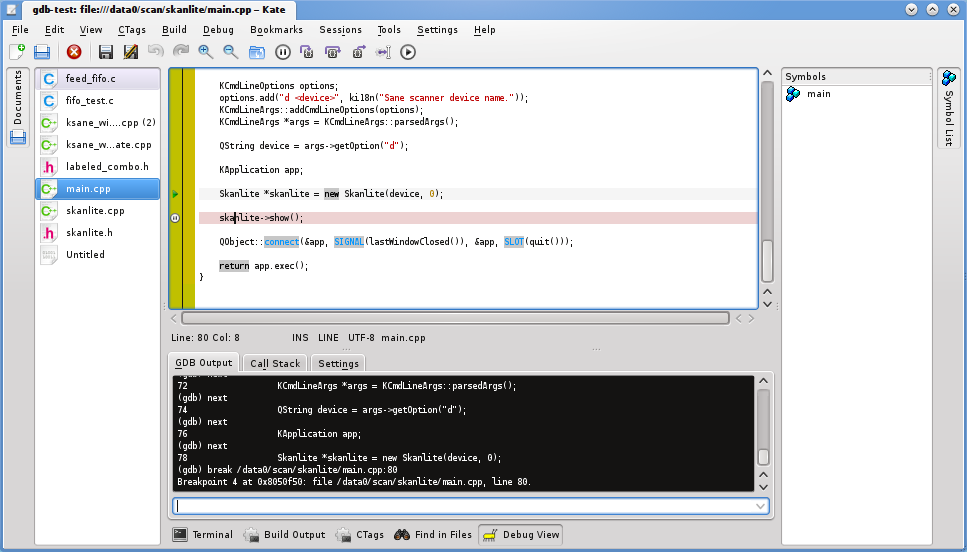
GDB Console, execution marker and a breakpoint marker.
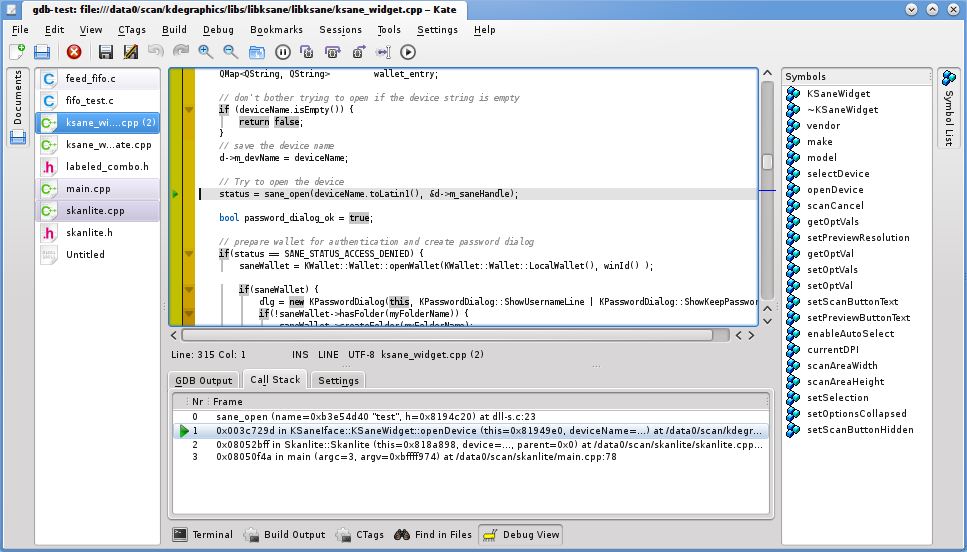
The current call stack.
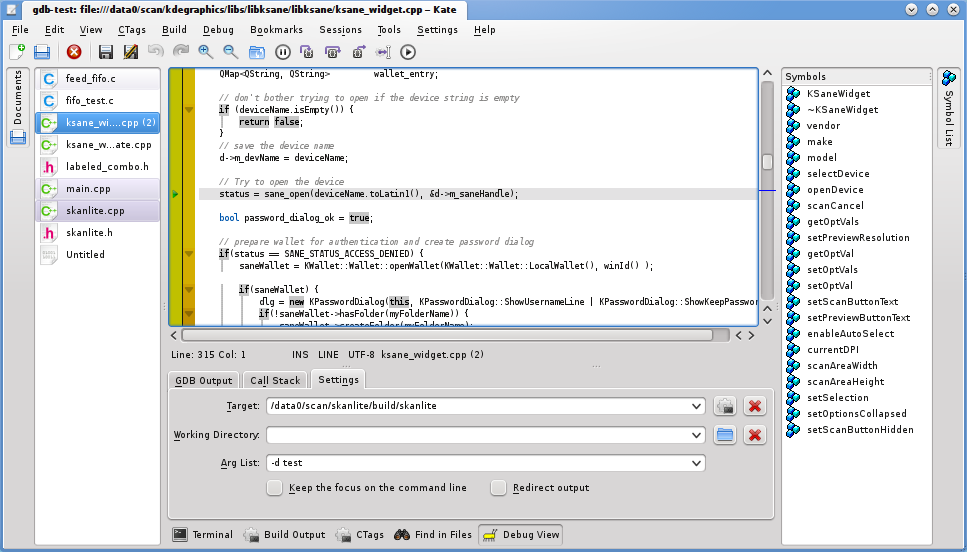
Settings tab.
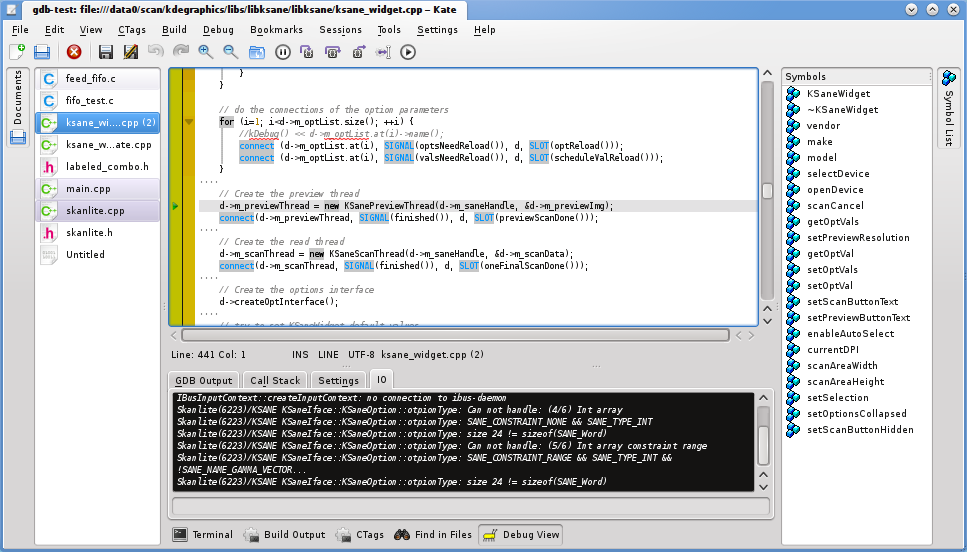
Redirected IO.
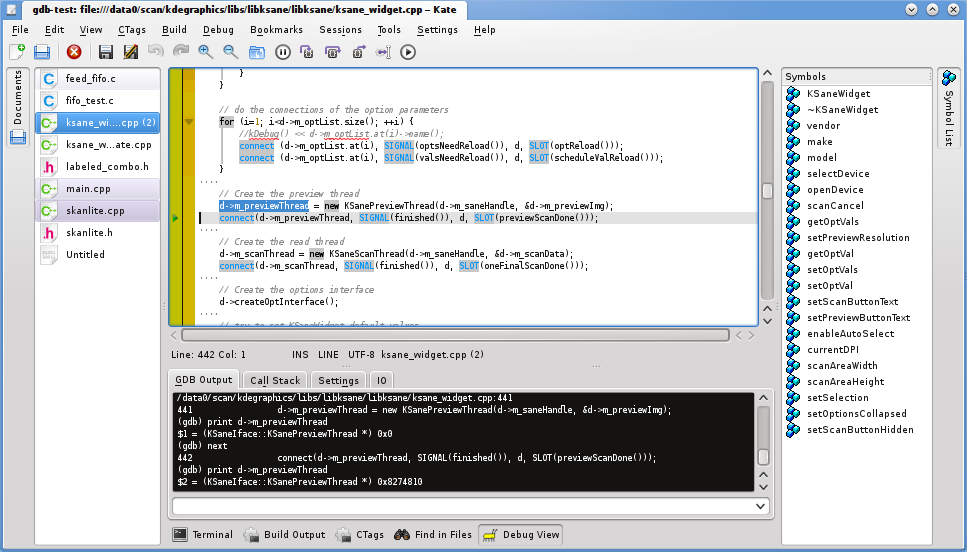
The selected variable and the GDB value output.
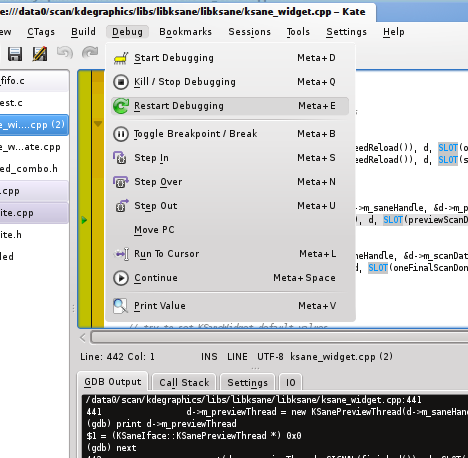
The debug menu.